Coralis
Joo Chiat Road East
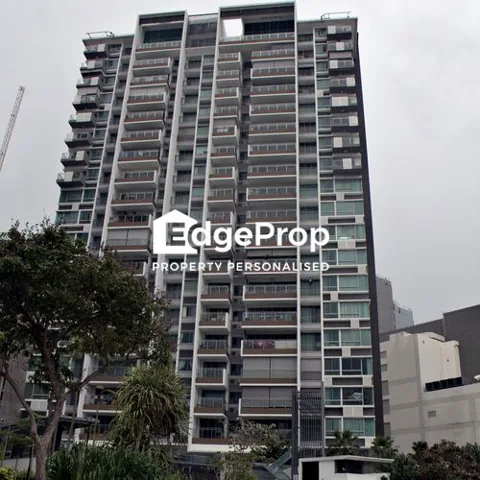
Coralis:
performance and activity.
Compare the project's recorded one-bedroom sale prices over time. Rent figures show their reported quarter.
Past one-bedroom sales at Coralis
Transactions labelled as one-bedroom by TwoHomes ↗. Bedroom types are taken from the source classification, with no floor-area matching. The records include new sales, sub-sales and resales.
Showing all 59 eligible one-bedroom transactions from 26 Mar 2010 to 15 May 2026. All 59 source one-bedroom records were retrieved across 1 page.
| Date | Area | Price | PSF | Sale |
|---|---|---|---|---|
| 15 May 2026 | 495.14 sq ft | S$1,000,000 | S$2,020 / sq ft | Resale |
| 12 Nov 2025 | 495.14 sq ft | S$1,025,000 | S$2,070 / sq ft | Resale |
| 23 Jul 2025 | 495.14 sq ft | S$1,080,000 | S$2,181 / sq ft | Resale |
| 15 Jun 2022 | 495.14 sq ft | S$940,000 | S$1,898 / sq ft | Resale |
| 23 Apr 2021 | 495.14 sq ft | S$930,000 | S$1,878 / sq ft | Resale |
| 17 Feb 2021 | 495.14 sq ft | S$900,000 | S$1,818 / sq ft | Resale |
| 16 Feb 2021 | 495.14 sq ft | S$945,000 | S$1,909 / sq ft | Resale |
| 5 Oct 2018 | 495.14 sq ft | S$880,000 | S$1,777 / sq ft | Resale |
| 18 Apr 2018 | 495.14 sq ft | S$928,000 | S$1,874 / sq ft | Resale |
| 24 Apr 2017 | 495.14 sq ft | S$860,000 | S$1,737 / sq ft | Resale |
| 13 Mar 2017 | 495.14 sq ft | S$688,000 | S$1,389 / sq ft | Resale |
| 6 Sep 2016 | 495.14 sq ft | S$868,000 | S$1,753 / sq ft | Resale |
| 8 Apr 2016 | 495.14 sq ft | S$838,888 | S$1,694 / sq ft | Resale |
| 16 Jan 2015 | 495.14 sq ft | S$890,000 | S$1,797 / sq ft | Sub Sale |
| 19 Mar 2014 | 495.14 sq ft | S$900,000 | S$1,818 / sq ft | Sub Sale |
| 20 Nov 2013 | 495.14 sq ft | S$865,000 | S$1,747 / sq ft | Sub Sale |
| 13 Nov 2013 | 495.14 sq ft | S$903,000 | S$1,824 / sq ft | Sub Sale |
| 5 Nov 2013 | 495.14 sq ft | S$900,000 | S$1,818 / sq ft | Sub Sale |
| 11 Oct 2013 | 495.14 sq ft | S$868,000 | S$1,753 / sq ft | Sub Sale |
| 4 Oct 2012 | 495.14 sq ft | S$850,000 | S$1,717 / sq ft | Sub Sale |
| 20 Sep 2012 | 495.14 sq ft | S$835,000 | S$1,686 / sq ft | Sub Sale |
| 20 Sep 2012 | 495.14 sq ft | S$825,000 | S$1,666 / sq ft | Sub Sale |
| 4 Sep 2012 | 495.14 sq ft | S$768,000 | S$1,551 / sq ft | Sub Sale |
| 31 Aug 2012 | 495.14 sq ft | S$833,000 | S$1,682 / sq ft | Sub Sale |
| 10 Apr 2012 | 495.14 sq ft | S$845,000 | S$1,707 / sq ft | Sub Sale |
| 11 Oct 2010 | 495.14 sq ft | S$698,524 | S$1,411 / sq ft | New Sale |
| 7 Oct 2010 | 495.14 sq ft | S$722,910 | S$1,460 / sq ft | New Sale |
| 13 Apr 2010 | 495.14 sq ft | S$740,577 | S$1,496 / sq ft | New Sale |
| 13 Apr 2010 | 495.14 sq ft | S$760,541 | S$1,536 / sq ft | New Sale |
| 13 Apr 2010 | 495.14 sq ft | S$715,859 | S$1,446 / sq ft | New Sale |
| 12 Apr 2010 | 495.14 sq ft | S$710,631 | S$1,435 / sq ft | New Sale |
| 12 Apr 2010 | 495.14 sq ft | S$775,752 | S$1,567 / sq ft | New Sale |
| 12 Apr 2010 | 495.14 sq ft | S$765,228 | S$1,545 / sq ft | New Sale |
| 12 Apr 2010 | 548.96 sq ft | S$771,536 | S$1,405 / sq ft | New Sale |
| 12 Apr 2010 | 495.14 sq ft | S$700,649 | S$1,415 / sq ft | New Sale |
| 12 Apr 2010 | 495.14 sq ft | S$700,649 | S$1,415 / sq ft | New Sale |
| 12 Apr 2010 | 548.96 sq ft | S$771,536 | S$1,405 / sq ft | New Sale |
| 9 Apr 2010 | 495.14 sq ft | S$753,406 | S$1,522 / sq ft | New Sale |
| 9 Apr 2010 | 495.14 sq ft | S$750,559 | S$1,516 / sq ft | New Sale |
| 9 Apr 2010 | 495.14 sq ft | S$765,770 | S$1,547 / sq ft | New Sale |
| 9 Apr 2010 | 495.14 sq ft | S$703,524 | S$1,421 / sq ft | New Sale |
| 9 Apr 2010 | 495.14 sq ft | S$700,000 | S$1,414 / sq ft | New Sale |
| 8 Apr 2010 | 495.14 sq ft | S$720,613 | S$1,455 / sq ft | New Sale |
| 8 Apr 2010 | 495.14 sq ft | S$715,859 | S$1,446 / sq ft | New Sale |
| 8 Apr 2010 | 495.14 sq ft | S$730,595 | S$1,476 / sq ft | New Sale |
| 7 Apr 2010 | 495.14 sq ft | S$755,788 | S$1,526 / sq ft | New Sale |
| 6 Apr 2010 | 495.14 sq ft | S$774,801 | S$1,565 / sq ft | New Sale |
| 5 Apr 2010 | 495.14 sq ft | S$740,577 | S$1,496 / sq ft | New Sale |
| 5 Apr 2010 | 495.14 sq ft | S$742,500 | S$1,500 / sq ft | New Sale |
| 1 Apr 2010 | 495.14 sq ft | S$779,555 | S$1,574 / sq ft | New Sale |
| 1 Apr 2010 | 495.14 sq ft | S$735,824 | S$1,486 / sq ft | New Sale |
| 31 Mar 2010 | 495.14 sq ft | S$745,806 | S$1,506 / sq ft | New Sale |
| 30 Mar 2010 | 495.14 sq ft | S$735,824 | S$1,486 / sq ft | New Sale |
| 30 Mar 2010 | 495.14 sq ft | S$748,230 | S$1,511 / sq ft | New Sale |
| 30 Mar 2010 | 495.14 sq ft | S$738,347 | S$1,491 / sq ft | New Sale |
| 30 Mar 2010 | 495.14 sq ft | S$720,613 | S$1,455 / sq ft | New Sale |
| 29 Mar 2010 | 495.14 sq ft | S$765,295 | S$1,546 / sq ft | New Sale |
| 26 Mar 2010 | 495.14 sq ft | S$780,981 | S$1,577 / sq ft | New Sale |
| 26 Mar 2010 | 495.14 sq ft | S$770,048 | S$1,555 / sq ft | New Sale |
S$3,450 / month
Median of 18 one-bedroom leases, 2026 Q3.
S$2,045 / sq ft
Average of all 2 source-classified one-bedroom sales in the 12 months to 5 Nov 2026. All one-bedroom sizes are included.
Average one-bedroom PSF by year
S$2,020 psf2026 · 1 sale
All 59 eligible source-classified one-bedroom transactions at Coralis. All one-bedroom sizes are included; no size filter or five-year limit is applied.
Scroll the chart to see all years.
Dashed lines connect years without intervening one-bedroom records. *Current year is partial. Source checked 5 Nov 2026; all available years are included. Each value is the simple average PSF of classified one-bedroom transactions that year, including new sales, sub-sales and resales. Different homes may have sold in each year.
View yearly figures
| Year | Average PSF | Sales |
|---|---|---|
| 2010 | S$1,488 psf | 34 |
| 2011 | — | 0 |
| 2012 | S$1,668 psf | 6 |
| 2013 | S$1,786 psf | 4 |
| 2014 | S$1,818 psf | 1 |
| 2015 | S$1,797 psf | 1 |
| 2016 | S$1,724 psf | 2 |
| 2017 | S$1,563 psf | 2 |
| 2018 | S$1,826 psf | 2 |
| 2019 | — | 0 |
| 2020 | — | 0 |
| 2021 | S$1,868 psf | 3 |
| 2022 | S$1,898 psf | 1 |
| 2023 | — | 0 |
| 2024 | — | 0 |
| 2025 | S$2,126 psf | 2 |
| 2026* | S$2,020 psf | 1 |
The average recorded one-bedroom PSF was S$1,488 in 2010 and S$2,020 in 2026, 35.8% above the first recorded year. This compares annual sale averages; different homes and sale types may be represented in each year.
Sales follow the source's bedroom classifications. They have not each been checked against an individual floor plan.
The plan changes the answer.
Bring the current floor plan, unit number, asking price and balcony area into the conversation. Example sizes and directory comparisons cannot establish the value or availability of a particular home.
Discuss Coralis with an adviser ↗