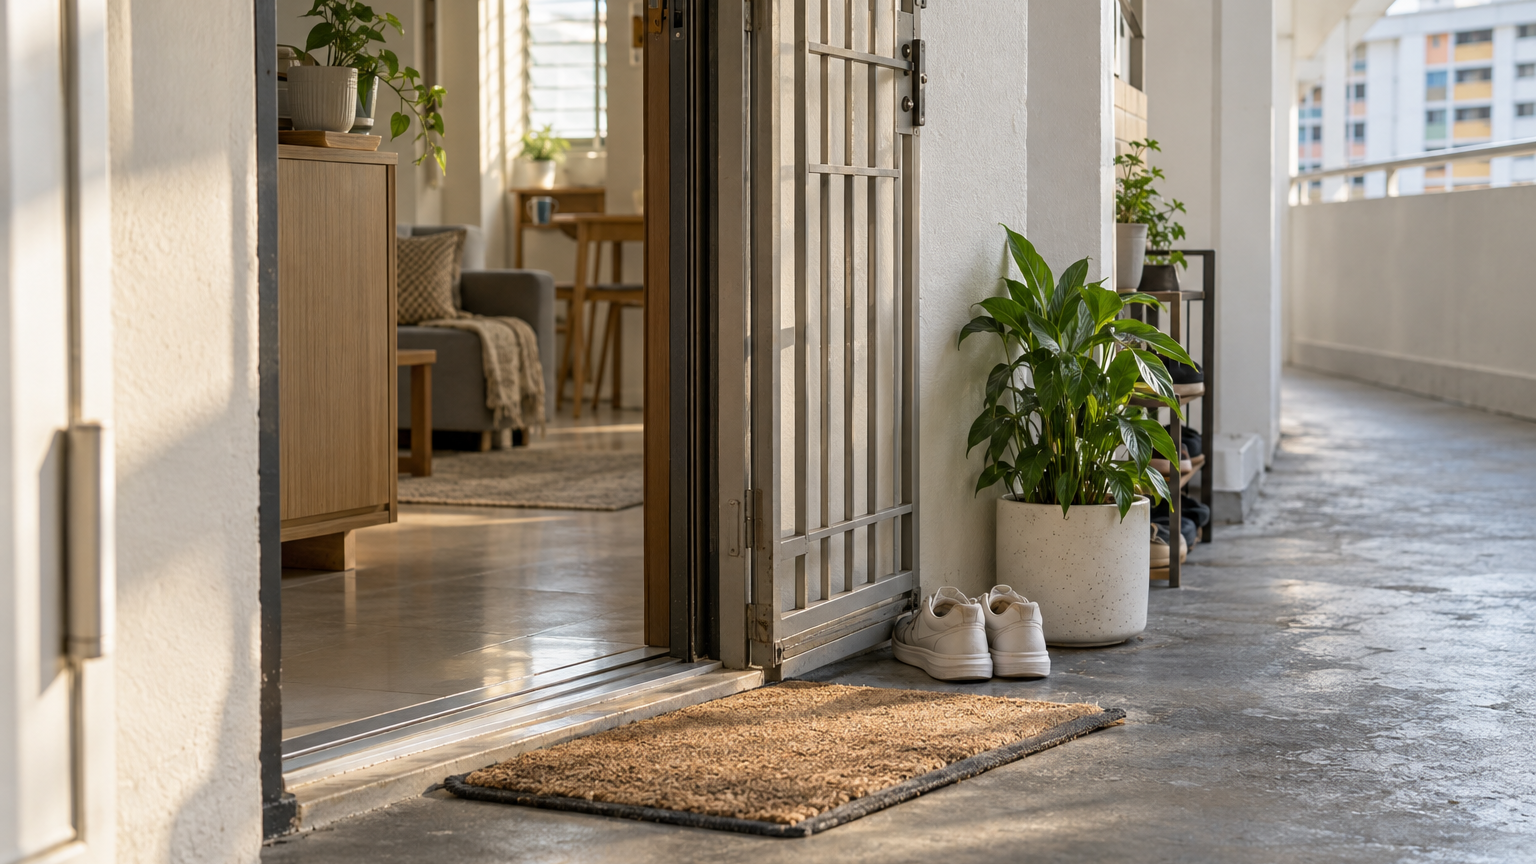
More HDB resale flats changed hands even as prices edged down in the third quarter of 2026. HDB recorded 7,645 resale transactions, up 19.5% from the previous quarter, while its resale price index slipped 0.1%. Over the same July-to-September period, private-home prices rose 1.4%, according to final figures released on 23 October.
For someone weighing a resale flat against a one-bedroom condominium, the striking contrast is between a busier HDB market with slightly softer prices and a private market becoming more expensive overall. But the private-home figures also contain a useful distinction: non-landed prices rose 1.0%, less than the headline increase covering all private homes. That is the closer starting point for a condominium comparison.
More HDB transactions, slightly lower prices
HDB’s resale price index stood at 202.5 in Q3. The 0.1% quarterly decline followed falls of 0.1% in Q1 and 0.3% in Q2, making this the third consecutive quarterly decrease.
The change in activity was considerably larger. Completed resale transactions increased from 6,396 in Q2 to 7,645 in Q3—an additional 1,249 deals, calculated from HDB’s figures. Compared with the 7,221 transactions a year earlier, Q3 volume was 5.9% higher.
That combination matters because prices and activity answer different questions. The index describes the broad price direction; the transaction count tells us how many flats changed hands. This quarter, a marginally lower benchmark accompanied substantially more completed purchases, rather than a retreat in activity.
For a buyer, the practical reading is modest: there was more resale activity, but the national price movement was small. To assess an actual asking price, the useful next comparison would be recent completed sales of similar flats in the same area—not a blanket 0.1% adjustment to every listing.
The private-home rise was uneven
URA’s overall private residential price index rose 1.4%, compared with 0.5% in Q2. Within that result, non-landed prices increased 1.0%, with quite different movements across the three broad geographical segments.
Non-landed prices in the Outside Central Region—the broad suburban segment—rose 2.3%. Prices in the Rest of Central Region were unchanged, while those in the Core Central Region rose 0.3%. These are regional and property-type measures, not separate indices for one-bedroom homes.
The sales figures add another dimension. Developers sold 1,183 uncompleted private homes, excluding executive condominiums, down from 2,141 in Q2. Private resale transactions were almost unchanged at 3,801, against 3,813 previously. Higher prices therefore coincided with fewer developer sales and broadly steady resale activity.
The important limitation is that these releases do not identify one-bedroom price performance, individual floor plans or unit-level rental returns. A compact condo needs its own evidence: comparable completed transactions, its actual layout and documented ownership costs. The national and regional figures provide the backdrop, not that finished comparison.
Compare the price of a home with the space you will use
For a solo buyer, I would start a shortlist with two separate questions: What is the total purchase price? And how much of this particular home works for everyday living? Keeping those questions separate makes the comparison more useful than sorting listings by price per square foot alone.
On each floor plan, mark the enclosed bedroom, living area, kitchen and bathroom separately from the balcony. Then trace the route from the entrance to each room. Treat circulation—the space needed to move around—as its own consideration, rather than assuming every part of the advertised area offers the same practical use.
This is a suggested comparison method, not a finding about any project. A balcony may be a priority for someone who wants outdoor seating. Another buyer may prefer room for a desk, dining table or enclosed storage. The point is to decide what you value before comparing two homes through one area figure.
A viewing can turn that preference into a concrete test: where would your bed, work desk, laundry rack and luggage go? Would opening a wardrobe obstruct a passage? Could you use the living area comfortably while working from home? These questions require the actual plan and a visit; neither quarterly index can answer them.
Next, place the purchase price alongside a property-specific monthly budget. Request the maintenance charges and obtain a financing illustration for your own circumstances. Keep upfront spending separate from recurring payments so that a lower entry price does not become shorthand for an easier monthly commitment.
A rental increase is not a net-income statement
URA reported that non-landed private residential rents rose 1.2% in Q3. That establishes a firmer rental backdrop at the broad market level, but it does not supply the income or expenses of a particular one-bedroom unit.
For an investor comparison, begin with evidence of achievable rent for closely comparable units. Keep an advertised rent clearly labelled as an asking figure until there is evidence of an agreed tenancy. Likewise, an advertised yield should not be presented as verified net income.
A useful calculation should show its workings. Start with the rent expected over the assessment period, allow explicitly for any assumed vacancy, and then itemise maintenance, agent fees, repairs, insurance and applicable property tax. Keep loan interest and principal repayments visible separately: an operating-income calculation and a cash-flow budget answer different questions.
No unit-specific rent, expense schedule or financing quotation accompanies these quarterly releases. Consequently, there is no defensible net-yield percentage to attach to the one-bedroom market from this evidence alone. The useful output is a transparent calculation for an identified property, with assumptions labelled—not a market-wide promise.
Keep more than one exit route in view
The final comparison is about what happens when the home no longer suits you. For an owner-occupier, ask whether the layout could accommodate your next likely stage of life. For an investor, assess selling and continuing to rent it out as separate options, using property-specific evidence and checking the rules applicable to your circumstances.
Before committing, I would want a shortlist to show the purchase price, usable-layout assessment, monthly cash requirement and evidence for each proposed exit. If the rental option only works at an unverified asking rent, leave that uncertainty visible. If the resale comparison relies on a materially different unit, find a closer match rather than forcing the number.
Q3’s clearest result is that Singapore’s two broad housing benchmarks moved apart while HDB resale activity increased. The unresolved question for a one-bedroom buyer is narrower—and more useful: whether a particular compact home offers enough liveable space and manageable cost at its actual purchase price. That answer still has to come from the unit, not the index.